Chapter 2 · Optional lab
The visual lab
Realistic illustrations of the eye and retina, an interactive model of receptive fields and clickable maps of the visual pathways. No scores or assessments – explore for as long as it helps.
From retina to cortex
Vision is a conversation between many areas. As you recognise a cup, information about form, colour, movement and spatial relationships travels through interacting pathways. Select an area to see where its signals can go—and where signals can return from.
An interactive interpretation of Felleman & Van Essen (1991): 32 macaque cortical areas, selected connections. Felleman & Van Essen (1991)
When you look for the handle, position and contour matter; when you inspect the glaze, colour differences matter. Attention and feedback change priorities at several levels of interacting networks—not one isolated function per area or conscious intention in every arrow.
How to read the map
The map uses historical macaque anatomical nomenclature. The levels are a historical hierarchical arrangement derived from anatomy – not atlas positions, processing times or a single definitive modern order. MIP and MDP are poorly constrained in the original material.
This is a selection of positively reported projections (Table 3, p. 10; laminar classes Table 5, pp. 18/20; hierarchy Figure 4, p. 30). A missing line does not mean a missing pathway. The original contains both full and preliminary reports; uncertain reports and aggregate group entries have not been expanded. There are no empirical weights or timings, and the layout is not brain geometry. Felleman & Van Essen (1991)
Feedback and intention
Returning signals let context, attention and task demands influence processing across multiple parallel pathways. The drawing measures no activity, proves no particular intention, and does not mean all feedback is conscious or predictive. Read about parallel processing and top-down influence in 2.2
From the classic map to present-day questions
Later quantitative laminar work has refined the hierarchy and shown that connection strengths vary widely. The interface here is modern; the data comes from the historical mapping – not a claim to a new human connectome. Markov et al. (2014)
The counts refer to displayed connections between areas, not neurons, synapses or the amount of information.
The feedback marking is a reading aid for a well-defined subset – not all descending influences. An arrow means anatomical projection direction, not activity or timing.
Follow a route
Example anatomical routes – not measured temporal sequences or independent pipelines. Extend only along existing outgoing arrows.
Or start from the selected area:
The map ends here — processing continues
TF, TH and area 46 belong to wider networks for memory, working memory and action. They are not endpoints, and their position at the top of this map does not mean that they sit anatomically above the other areas.
Information also returns and influences what is prioritised in visual processing. Read about feedback to the thalamus →
Underlined buttons select the area's explanation in the map. Grey labels show context beyond the map – they are not new map areas or connections.
From the eye into the map
The retina lines the back of the eye. Ganglion-cell axons leave the eye in the optic nerve. A main route runs via the LGN in the thalamus to V1 in the cortex of the occipital lobe. The thalamus lies below the cortex; the SC lies in the midbrain. V1 is the first cortical stage on this particular LGN–V1 route. The lower row is a separate, parallel route – not a step after the LGN – and not all signals pass through V1 first.
The buttons open the retina module, the guided pathways, or select V1 in the map.
Read about the routes through the thalamus →Read about feedback to the thalamus →
- feedforward
- feedback
- lateral
- laminar class not assigned in this edition
- Early visual areas
- Parietal areas
- Motion and superior temporal sulcus
- Ventral temporal areas
- Frontal areas
- Medial temporal areas
The numbers 1–10 on the left are historical hierarchy levels derived from anatomy – not atlas positions or processing times.
Connections as a list
- · feedforward
- · feedback
- · feedforward
- · feedforward
- · feedforward
- · feedforward
- · laminar class not assigned in this edition
- · laminar class not assigned in this edition
- · feedforward
- · laminar class not assigned in this edition
- · feedforward
- · feedforward
- · laminar class not assigned in this edition
- · laminar class not assigned in this edition
- · laminar class not assigned in this edition
- · feedback
- · feedback
- · feedback
- · feedback
- · laminar class not assigned in this edition
- · feedback
- · feedback
- · feedback
V2 – Second visual area (occipital lobe, surrounding V1)
Extends V1 processing of edges, figures and binocular differences.
Contribution to vision
V2 relates local edges to the surrounding configuration and also contributes to binocular-disparity processing. Many studied macaque V2 neurons signal which side of an edge belongs to a figure: the same local edge can evoke different responses depending on its surround.
The cup’s contour can separate cup from table; this information supports further interpretation, rather than being completed conscious recognition.
Border ownership: primary macaque recordings. The historical primate synthesis also describes disparity sensitivity in V2.
Functional evidence and species
- Zhou, H., Friedman, H. S. & von der Heydt, R. (2000). Coding of border ownership in monkey visual cortex. Journal of Neuroscience, 20, 6594–6611. DOI: 10.1523/JNEUROSCI.20-17-06594.2000.
Primary macaque recordings: V2/V4 responses to which side of an edge belongs to a figure, depending on surrounding configuration.
- Felleman, D. J. & Van Essen, D. C. (1991). Distributed hierarchical processing in the primate cerebral cortex. Cerebral Cortex, 1(1), 1–47. DOI: 10.1093/cercor/1.1.1-a.
Synthesis of macaque cortical connectivity; a compilation of monkey data, not a human atlas.
In this displayed selection: incoming 9 · outgoing 14
Connection source: Felleman & Van Essen (1991) – Table 3 (p. 10); laminar classes Table 5 (pp. 18/20).
Incoming connections
- feedforward
- feedback
- feedback
- feedback
- feedback
- laminar class not assigned in this edition
- feedback
- feedback
- feedback
Outgoing connections
- feedback
- feedforward
- feedforward
- feedforward
- feedforward
- laminar class not assigned in this edition
- laminar class not assigned in this edition
- feedforward
- laminar class not assigned in this edition
- feedforward
- feedforward
- laminar class not assigned in this edition
- laminar class not assigned in this edition
- laminar class not assigned in this edition
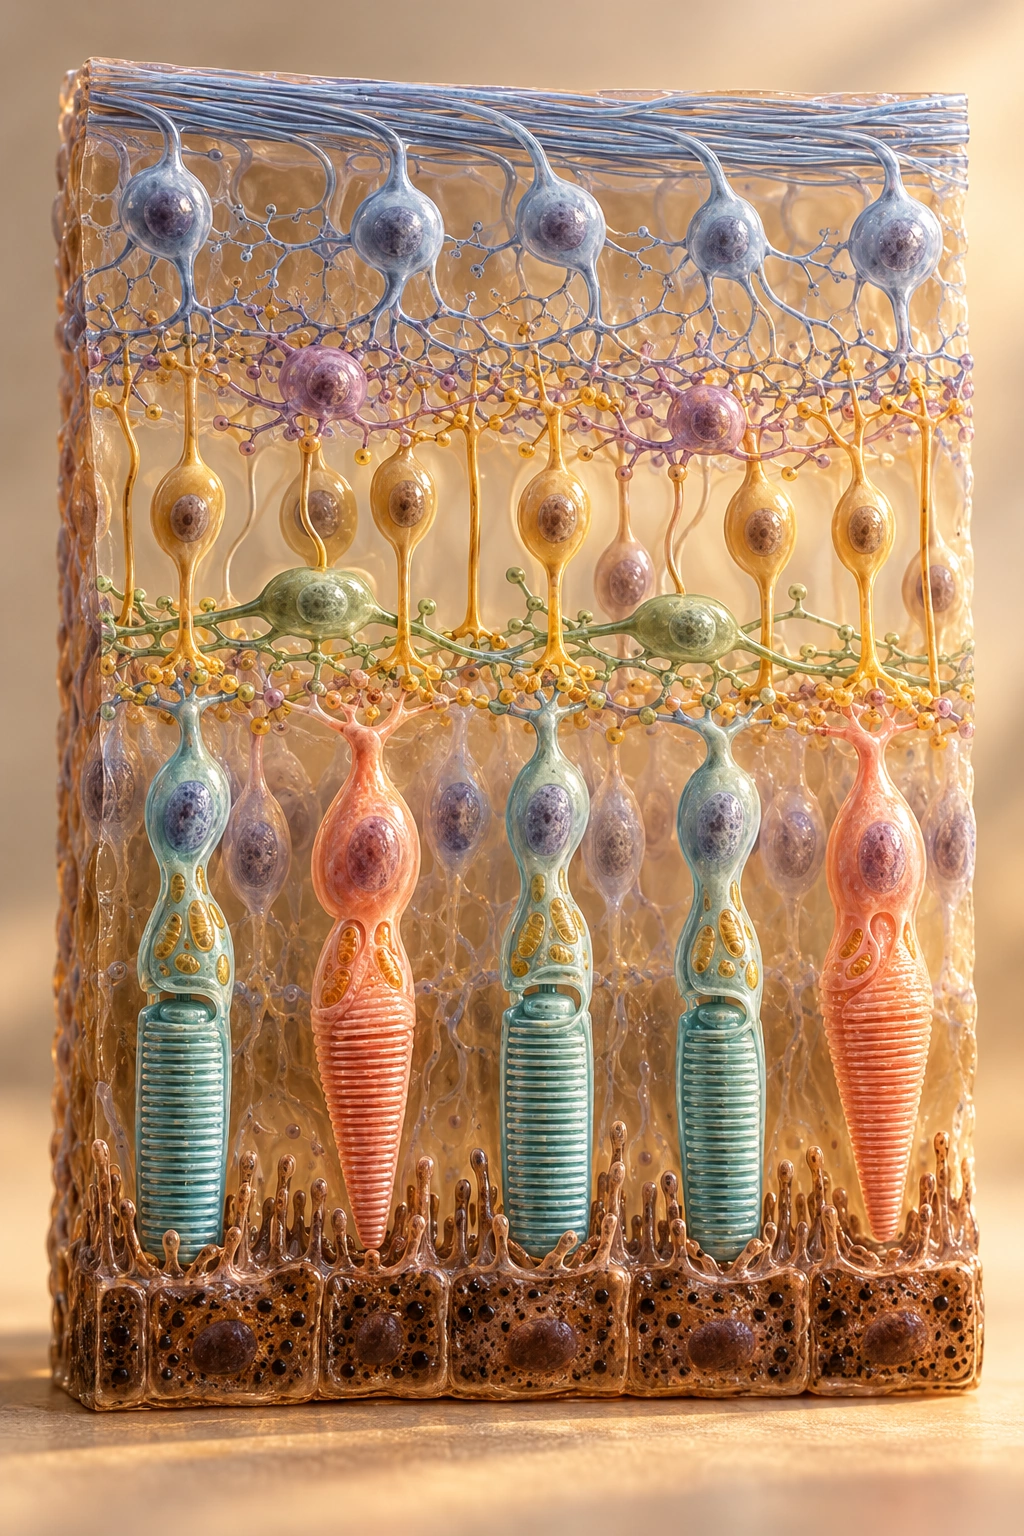
Start with the retinal ganglion cells: it is their axons that leave the eye and form the optic nerve. Explore the retina
- Eye
- The retina lines the inner back of the eye.
- Below the cerebral cortex
- The LGN lies in the thalamus, deep within the brain.
- Cerebral cortex
- Via the LGN, the main pathway first reaches V1 in the occipital lobe.
The SC lies in the midbrain; the pulvinar lies in the thalamus. Both are subcortical.
The main route: ganglion cell axons → LGN in the thalamus → V1 → onwards in ventral and dorsal networks. An alternative route runs via the midbrain's superior colliculus and the pulvinar.
When you look for the handle, position and contour matter; when you inspect the glaze, colour differences matter. Attention and feedback change priorities at several levels of interacting networks—not one isolated function per area or conscious intention in every arrow.
About this map
The maps omit the optic chiasm crossing and bilateral geometry for readability; placement shows function, not atlas position.
- RetinaLGNprojection
- LGNV1projection
- V1LGNfeedback
- RetinaSCprojection
- SCInferior pulvinarprojection
- Inferior pulvinarMT / hMT+projection
- V1ITbundled network route · ventral network
- V1Parietal / IPSbundled network route · dorsal network
Selected connections – not an exhaustive anatomical atlas.
Retina – in the eye
The retina is a thin layer of neural tissue lining the inner back of the eye. It is the ganglion cells' axons that leave the eye in the optic nerve and tract – not the photoreceptors. Different ganglion cell types provide the basis for parallel pathways to the brain.
Connections in this view
- projection · evidence: Callaway (2005)
- projection · evidence: Berman (2010)
Sources on this area: Purves (2001) · Callaway (2005) All sources
Illustrations and models for learning; not measurements.