Chapter 2 · Section 1
How does the world become an experience?
You see a cup, hear a voice and feel the surface of the table. How can physical events become a world that can be recognised and acted in?
From physical forces to sensory experience
We see light falling across the table, hear someone speak and feel the warmth of a cup of coffee. To us these are colours, voices and warmth. To understand how such experiences become possible, we also need to examine what is happening in our surroundings and how it affects our sense organs.
Four forces behind the world we meet
Physics describes four fundamental interactions – four basic ways in which matter and energy influence one another. They operate in very different settings:
- GravityGravity is tied to mass and energy. It keeps us on the Earth and governs the motions of the planets.
- ElectromagnetismElectromagnetism acts between electrically charged particles. Light is electromagnetic radiation. The same interaction plays a decisive role in chemical bonds and in the forces that arise when objects come into contact.
- Strong interactionThe strong interaction binds quarks together inside protons and neutrons. A residual part of it holds protons and neutrons together in atomic nuclei.
- Weak interactionThe weak interaction is involved in, among other things, certain forms of radioactive decay.
Different routes into the sense organs
Electromagnetism is therefore central to the physical and chemical conditions on which the senses depend. But what reaches a sense organ may be light, mechanical force or molecules. That difference is needed to understand how each sense works.
Light can be absorbed by molecules in the photoreceptors of the retina. Sound, by contrast, consists of mechanical pressure waves that set structures in the ear in motion. That electromagnetic forces contribute to the properties of materials does not make sound electromagnetic radiation. In touch the skin is deformed, whereas smell and taste begin when substances act on sensitive proteins and ion channels in sensory cells. The cup’s warmth is registered through temperature-sensitive mechanisms in the skin.
How do we sense gravity?
In two small sacs of the inner ear, the utricle and the saccule, hair cells extend their bundles into a gel-like layer carrying tiny crystals of calcium carbonate. When the head tilts, this layer can shift relative to the hair cells. The bundles bend, and the cells' electrical activity changes.
These organs register the effects of both gravity and linear acceleration. Their signals alone are therefore not always enough to tell a tilt from a movement. The nervous system combines them with information from the semicircular canals and from vision, among other sources, to judge how the head is oriented and moving.
Do we have senses for the nuclear forces?
No known human sense organ directly registers the strong or weak interaction. Both act over very short distances within matter. Their consequences can still affect us: radioactive decay, for example, can give rise to radiation that affects the body's cells. Being affected biologically is not the same as being able to perceive the influence with a sense.
From stimulation to neural activity
When light, movement or substances change the electrical activity of a sensory cell, this is called sensory transduction. In the retina, absorbed light triggers a chain of chemical reactions. In the ear, bending of hair-cell bundles can change which ions pass through the cell membrane. Different mechanisms thus turn influences from the surroundings into signals that the nervous system can process.
Being electrical does not make the signals all alike. Which cells respond, when they respond and how activity is distributed among them carry information about what is happening.
How does this become an experienced world?
A description of the wavelengths of light is not the same as a description of the colour we see. Nor are the pressure variations in the air the experience of a voice. To explain perception, we need to follow how the nervous system processes the signals and how that processing relates to what we perceive. The terms sensation and perception emphasise different aspects of it.
This processing takes place in many parallel streams with feedback. Context, experience and attention can influence how the information is interpreted. At the same time, experience is bound to the information that is available; we cannot freely decide how something will look or sound.
That the brain uses expectations to interpret incoming signals is an important research idea, supported among other things by studies of the visual cortex. It offers a way to investigate perception, but it is not a finished explanation of everything we experience.
One event, three questions
What happens at the cup, what do the sense organs register, and what do we perceive? Choose a sense to follow the connection.
Three panels in sequence: the surroundings, receptors and nervous system, and what we perceive. Arrows lead from panel to panel. A feedback arrow from experience and attention points to processing in the nervous system, and an action arrow leads back to the surroundings.
1The surroundings
Light from the lamp is reflected from the cup and the table. Some of it reaches the eye.
2Receptors and nervous system
Transduction
Light is absorbed in the photoreceptors and changes their electrical activity – a graded receptor potential, not a nerve impulse.
Processing in the nervous system
The retina emphasises contrasts, among other features. Colour, form and context are processed further in interacting brain areas.
3What we perceive
You see a white cup standing on the table.
Movement changes the input to the senses
When you move your gaze, different parts of the scene fall on different parts of the retina.
Back to 1 · The surroundings
Perceiving and acting belong together
When you turn your head, shift your gaze or feel the surface of the cup, you change the information that reaches your senses. What you perceive in turn helps you choose your next movement. Perception and motor control are therefore part of recurring loops in which the information is constantly changing. The chapter returns to this in how the brain controls movement and prediction in movement.
The light from the cup
We begin with the light that reaches the eye from the cup and the table.
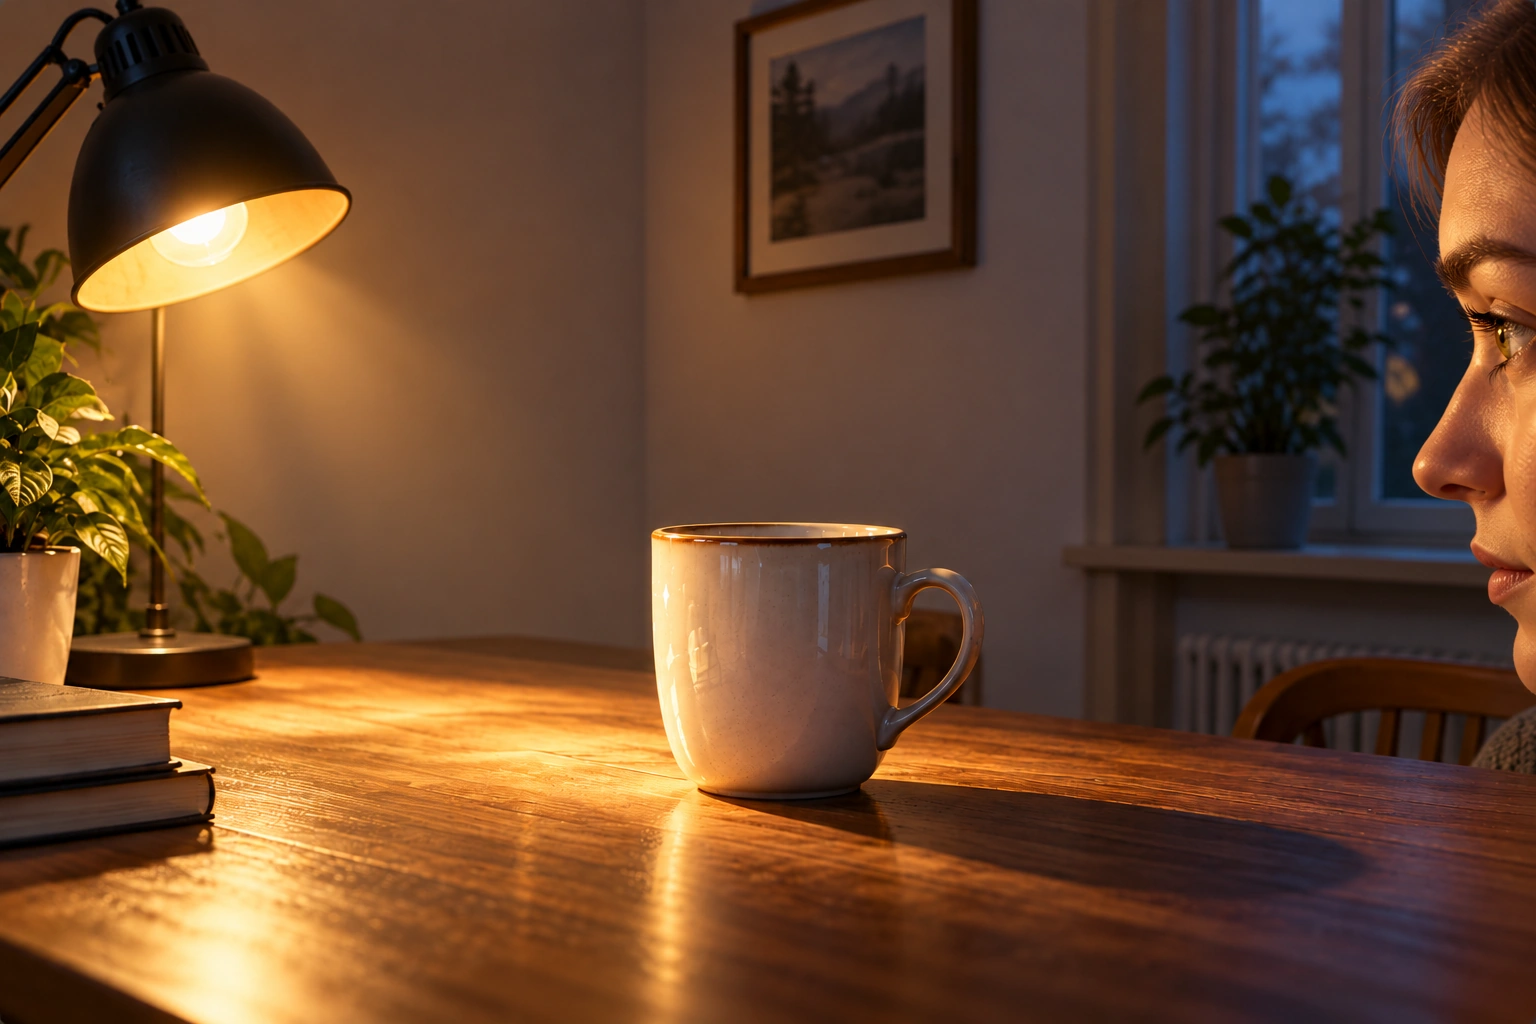
- 1Light source
- 2Illuminated cup surface
- 3Wall
- 4Table
- 5The eye receives light
Most of what we see is reflected light
A lamp emits light. We see the cup, table and wall because they reflect light that reaches them. This is how we see most everyday objects: light from the Sun or a lamp reaches their surfaces, and some of the reflected light reaches our eyes.
Light can be described in terms of photons – small packets of energy. When light meets a material, some photons are absorbed: their energy is transferred to the material and can contribute to warming it. Others are reflected and may reach an eye or another surface. Saying that light “bounces” describes its change of direction at a surface.
Reflection
The same matte ceramic
Reflection: a matte surface scatters reflected light in many directions. This lets us see the surface from different positions.
Absorption
The same matte ceramic · Energy to the material
Absorption: the photon's energy is transferred to the material. The absorbed photon does not continue towards the eye.
Light and colour in the image
Imagine standing in the room and pointing a measuring instrument at the cup. The instrument separates light arriving from the surface by wavelength. Its curve shows how much light reaches it across different parts of the visible spectrum.
Here we simulate such a measurement using the image’s colour values. The curve is one possible, simplified example — not a measurement of the room. The same image colour can correspond to several different spectra.
Point or tap in the image. Drag the probe’s round handle; swipe elsewhere in the image to scroll the page. With the handle focused, arrow keys move the probe. Adjust the wavelength slider. When you leave the image, the last sample stays selected.
Loading image colour values …
The scale is the same throughout the image. 100% is the model’s reference level for digital white.
Continue to colour vision and colour constancy.
Arriving light and surface reflectance
A spectroradiometer measures light reaching the instrument, resolved by wavelength. The free spectrum here shows relative simulated received light, not reflectance.
A spectrophotometer determines spectral reflectance using controlled illumination and a reference. Reflectance is the fraction of incoming light reflected by the surface at each wavelength. In the surface model these fractions are authored curves, not measurements of the image.
The lamp and the surface shape the light together
Daylight and lamplight contain different amounts of light at different wavelengths. This distribution is called the light source’s spectral distribution. When light meets the cup, some is absorbed and the rest is reflected. The fraction reflected at each wavelength depends on the surface.
Changing the light source can therefore change the light from the cup even though the cup itself stays the same. If the source has almost no light at certain wavelengths, the surface cannot reflect much light at those wavelengths, even if its reflectance there is high.
At each wavelength: reflected light = incoming light × reflectance / 100.
The source profiles and surface curves are authored examples, not measurements of daylight, lamps or the pictured objects. The model represents a matte, opaque, non-fluorescent surface and keeps viewing angle and light scattering unchanged. The scales are fixed; the examples do not have equal total light energy.
A surface does not tell the whole story — continue to colour constancy
Materials absorb and reflect different amounts at different wavelengths. Light from the cup therefore carries information about both the illumination and the cup's surface. This will matter when we explore colour vision and colour constancy.
Authoritative background: NASA: Wave Behaviors · NASA: Interactions Between Light and Matter · OpenStax: The Law of Reflection
A cup stands on the table in front of you. You perceive its shape, colour and distance almost without effort. But what reaches the eye is light reflected from the cup and its surroundings. For you to recognise the cup, the nervous system must process the pattern of light. The information becomes useful when you choose the cup and reach for it.
The senses' limited window
Vision provides a clear example. Visible light occupies a limited part of the electromagnetic spectrum. Radio waves, infrared and ultraviolet radiation also belong to this spectrum, but we do not normally see them directly. A radio receiver can convert a radio signal into sound; this does not mean that the ear itself detects radio waves.
Visible light · enlarged
Explore the wavelength
The shorter the wavelength, the closer the crests, and the marker in the enlarged strip above follows along. The horizontal scale of the wave is arbitrary: only the relationship between crest spacing and wavelength is depicted. The colour is a rough estimate of how the wavelength appears, not a measurement.
Wavelength as sine waves
Schematic curves with longer wavelength at the top and shorter at the bottom, in the same order as the colour strip above. The distance between crests shows the wavelength; the curves are not drawn to physical scale. Each wave depicts a single wavelength, whereas white light is a mixture of many. The colour a wavelength appears as is approximate.
The wavelengths our eyes normally detect, roughly 380–700 nm. Sensitivity varies across the range.
Visible light is a small part of the electromagnetic spectrum. The bands are schematic and are not drawn to scale. The limits of vision are approximate.
NASA Science: Introduction to the Electromagnetic Spectrum ↗ (new tab) · Visible Light ↗ (new tab)
What is shown and what we experience
Now: dark surround on the left, light on the right. Both small squares have the same shade of grey.
The difference in perceived lightness is an example of simultaneous contrast. The demonstration lets you change the surround while the squares' shade of grey stays the same. It shows an influence of context, but does not by itself settle which neural mechanisms cause it.Technical note: both small squares have the colour value #929292 in both states.
The example shows why we need to distinguish between a property of the image and our experience of it. What we see is affected by relationships between the image's parts. Knowing that the squares are identical does not necessarily make them look alike either.
Detecting, localising and recognising
The same stimulation can contribute to several tasks at once. As the cup slides, you detect the change, judge where it is and recognise the object you want to catch. These functions support one another; they need not unfold as three completely separate stages.
In everyday life we need to detect what is happening, localise it in relation to the body and recognise what it is. When you hear your name you can attend to the voice, judge roughly where it comes from and recognise the person speaking. Different aspects of the information are processed in parallel and can together guide your behaviour.
You can also turn your head to hear better or move your gaze to see who is speaking. The movement changes the information that reaches the senses. This is where perception and motor control meet: sensory information guides action, and action affects what we have the opportunity to perceive.
Processing in interacting networks
Colour, form, motion and spatial relations can be processed in parallel. Information also passes between areas that contribute different kinds of processing, and feedback influences earlier stages. Experience, context and attention can therefore affect what we perceive. This does not mean that we can freely choose what we see, as the contrast display above illustrates.
When several senses provide information about the same event, their contributions can be combined. In a conversation we use both the voice and the visible movements of the mouth. Perception thus connects events around us with the body's capacity to understand, orient and act.
The same questions arise in music, art, sport and the design of environments: what signals are available, what do we perceive, and how does that shape our actions?
The next question is how stimulation of a sensory receptor becomes a neural signal. →